Marine Geographers at Sea
Dawn Wright
Oregon State University
Department of Geosciences
104 Wilkinson Hall
Corvallis, OR 97331-5506

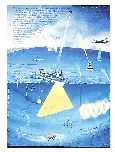 Various mapping/sampling tools used by marine geographers,
particularly acoustic swath mapping of the seafloor
(shown in yellow).
Various mapping/sampling tools used by marine geographers,
particularly acoustic swath mapping of the seafloor
(shown in yellow).
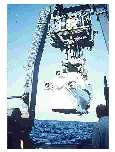 Launch of the famous Alvin submersible (used in the past to
photograph the wreck of the Titanic). Used by marine geographers
to map very small areas of the sea floor in great detail,
particularly at hydrothermal vents. Launch site shown in the
equatorial east Pacific, 500 miles SW of Acapulco, Mexico.
Launch of the famous Alvin submersible (used in the past to
photograph the wreck of the Titanic). Used by marine geographers
to map very small areas of the sea floor in great detail,
particularly at hydrothermal vents. Launch site shown in the
equatorial east Pacific, 500 miles SW of Acapulco, Mexico.
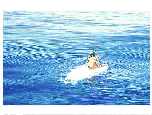 Alvin submersible in unseasonably calm waters in the northeast
Pacific. Alvin has just surfaced from a dive and is preparing to be
taken back aboard the mother ship.
Alvin submersible in unseasonably calm waters in the northeast
Pacific. Alvin has just surfaced from a dive and is preparing to be
taken back aboard the mother ship.
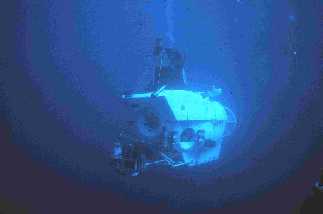 Alvin submersible descends to its maximum depth of 4,000 meters
(mean ocean depth is 3,800 meters). Alvin is currently the only
U.S. operated vehicle able to dive to these depths. Photo from
NOAA, National Undersea Research Program.
Alvin submersible descends to its maximum depth of 4,000 meters
(mean ocean depth is 3,800 meters). Alvin is currently the only
U.S. operated vehicle able to dive to these depths. Photo from
NOAA, National Undersea Research Program.
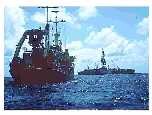 Two ships passing in the daylight. Ship in the foreground is the
Atlantis II (tender of the Alvin submersible). Ship in the background
is a scientific drill ship used for taking cores of rock and sediment
from the seafloor.
Two ships passing in the daylight. Ship in the foreground is the
Atlantis II (tender of the Alvin submersible). Ship in the background
is a scientific drill ship used for taking cores of rock and sediment
from the seafloor.
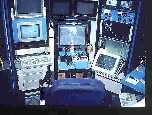 Cockpit of control van for running a remotely operated vehicle (ROV)
on the seafloor for mapping or sampling. This is the cockpit for the
ROV Ventana, operated by the Monterey Bay Aquarium Research Institute.
Cockpit of control van for running a remotely operated vehicle (ROV)
on the seafloor for mapping or sampling. This is the cockpit for the
ROV Ventana, operated by the Monterey Bay Aquarium Research Institute.
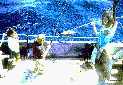
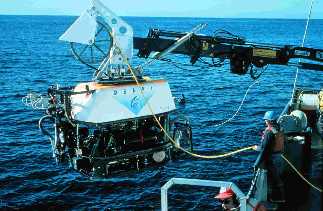 Launch of the remote operated vehicle (ROV) Ventana off the coast of
California. The ROV Ventana is operated by the Monterey Bay Aquarium
Research Institute. Photo by NOAA, National Undersea Research Program.
Launch of the remote operated vehicle (ROV) Ventana off the coast of
California. The ROV Ventana is operated by the Monterey Bay Aquarium
Research Institute. Photo by NOAA, National Undersea Research Program.
 Three-Dimensional visualization of eastern North America and the
Atlantic Ocean derived from ETOPO5 data and swath bathymetry
collected by marine geographers and oceanographers.
Three-Dimensional visualization of eastern North America and the
Atlantic Ocean derived from ETOPO5 data and swath bathymetry
collected by marine geographers and oceanographers.
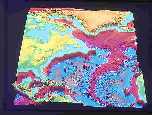
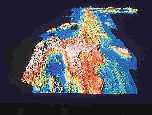 Shaded relief map of an active volcano (Axial Seamount -region
in white and orange) and a seafloor spreading center (Juan de Fuca Ridge)
off the Oregon/Washington coast. This region erupted in 1993 and
marine geographers have been tracking the processes at this site ever
since. No one has ever seen an eruption on the seafloor in real-time.
Scientists caught the 1993 event a few weeks after it actually occurred.
Shaded relief map of an active volcano (Axial Seamount -region
in white and orange) and a seafloor spreading center (Juan de Fuca Ridge)
off the Oregon/Washington coast. This region erupted in 1993 and
marine geographers have been tracking the processes at this site ever
since. No one has ever seen an eruption on the seafloor in real-time.
Scientists caught the 1993 event a few weeks after it actually occurred.
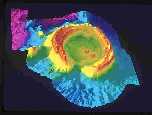 Three dimensional visualization of an underwater volcano discovered
and mapped by marine geographers in the spring of 1996 in the southwest
Pacific. The International Board of Geographic Names is in the process of
approving our submission for this volcano.
Three dimensional visualization of an underwater volcano discovered
and mapped by marine geographers in the spring of 1996 in the southwest
Pacific. The International Board of Geographic Names is in the process of
approving our submission for this volcano.
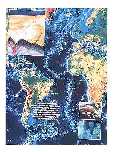 Map of the Mid-Atlantic Ridge seafloor spreading center that has
been studied by marine geographers.
Map of the Mid-Atlantic Ridge seafloor spreading center that has
been studied by marine geographers.
 GTOPO5 map of the world with the water drained off showing the world that
marine geographers deal with. Data obtained from the National Geophysical Data Center,
Boulder, CO.
GTOPO5 map of the world with the water drained off showing the world that
marine geographers deal with. Data obtained from the National Geophysical Data Center,
Boulder, CO.
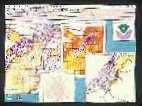 Screen dump from ESRI's ArcView program showing various kinds of
seafloor data being mapped and studied by marine geographers on
the Juan de Fuco Ridge off the coast of Oregon and Washington.
Screen dump from ESRI's ArcView program showing various kinds of
seafloor data being mapped and studied by marine geographers on
the Juan de Fuco Ridge off the coast of Oregon and Washington.
 Hydrothermal vent on the East Pacific Rise (500 miles southwest of
Acapulco). Water once came out of this vent at over 300 degrees C.
Crab in the foreground is about four inches long.
Hydrothermal vent on the East Pacific Rise (500 miles southwest of
Acapulco). Water once came out of this vent at over 300 degrees C.
Crab in the foreground is about four inches long.
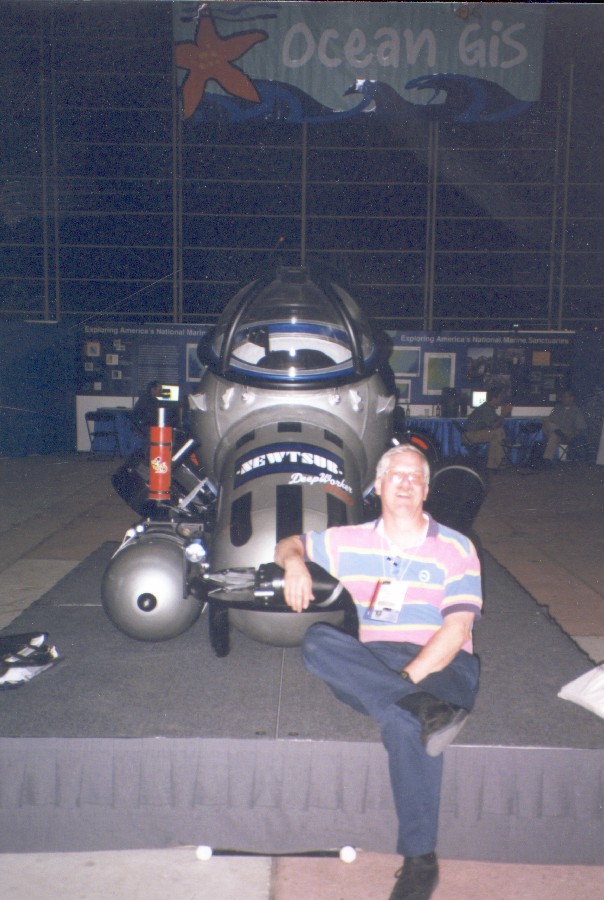 The "DeepWorker" single person submarine on display at the ESRI 1999 GIS Users Conference. The display was sponsored by the
National Oceanic and Atmospheric Administration to show the use of GIS in Ocean Research.
The "DeepWorker" single person submarine on display at the ESRI 1999 GIS Users Conference. The display was sponsored by the
National Oceanic and Atmospheric Administration to show the use of GIS in Ocean Research.
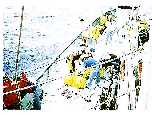 Deck work aboard an oceanographic research vessel. Scientists are
looking at instruments that were just brought on board.
Deck work aboard an oceanographic research vessel. Scientists are
looking at instruments that were just brought on board.
 "Layering" in a GIS by Dawn.
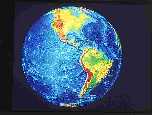 Global relief map of North and South America.
 Life at sea, crewmembers bring in a 40-lb tuna for dinner.
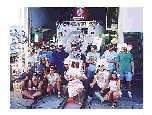 Life at sea (2). Participants of a hat contest aboard the Atlantis II.
Note Dawn Wright in center with the "computer geek" hat.
Life at sea (2). Participants of a hat contest aboard the Atlantis II.
Note Dawn Wright in center with the "computer geek" hat.
References
Wilson, J.P., Mitasova, H., and Wright, D.J. in press. Water resource applications of GIS. URISA Journal
Wright, D.J. and Bartlett, D.J. (Eds.). 1999. Marine and Coastal Geographical Information Systems. Taylor & Francis, London.
Wright, D.J. 1999. Getting to the bottom of it: Tools, techniques, and discoveries of deep ocean geography. The Professional Geographer 51: 426-439.
Return to the Table of Contents